Reports
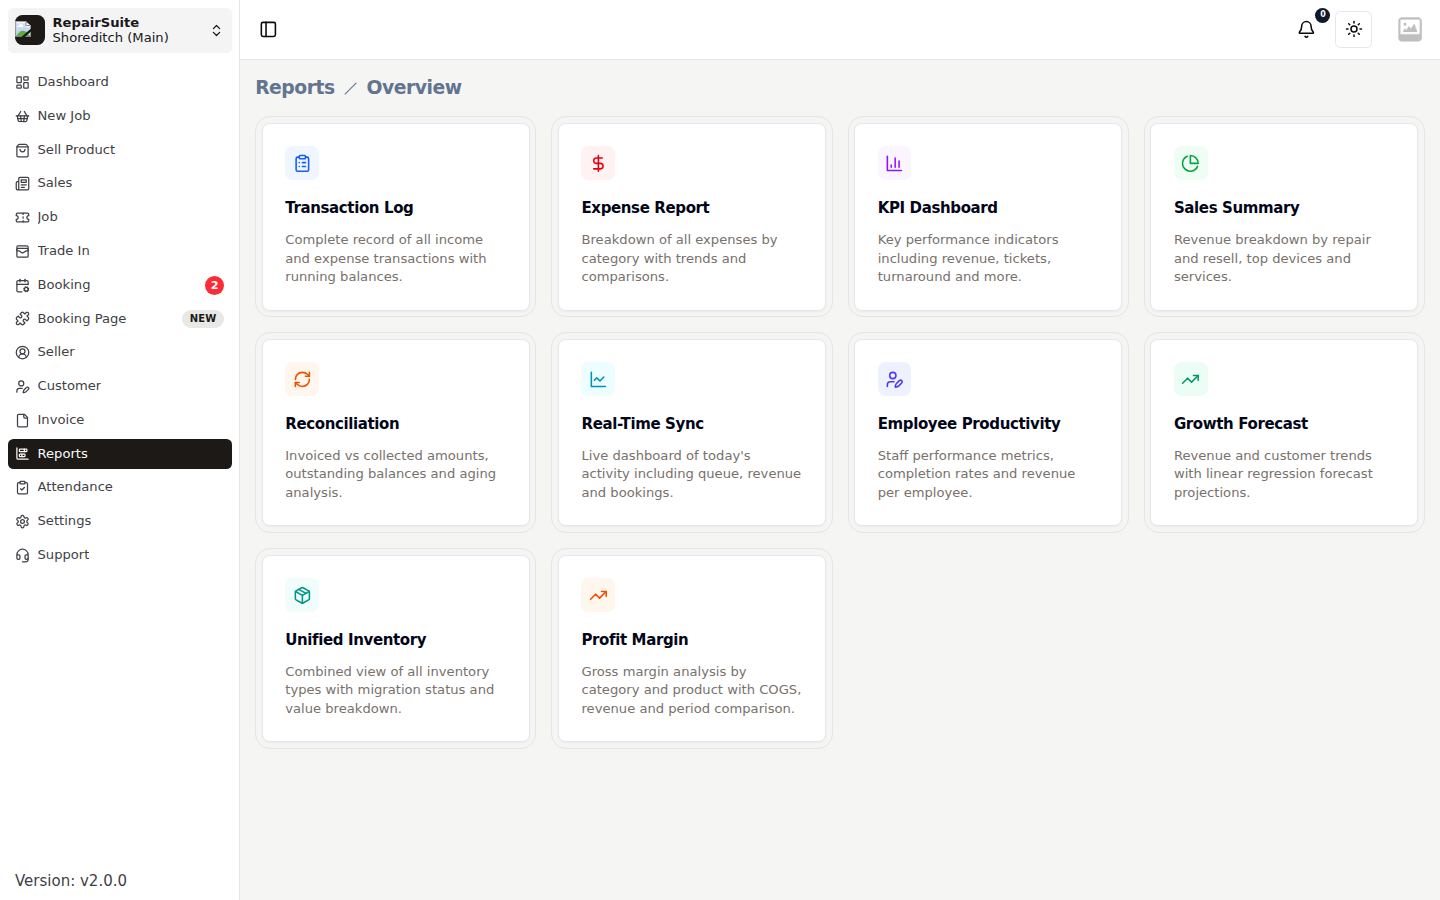
Reports collects every analytical view in RepairSuite. Everything is scoped to the branch you are working in and to the date range you pick, and most reports export to CSV.
Sales Summary
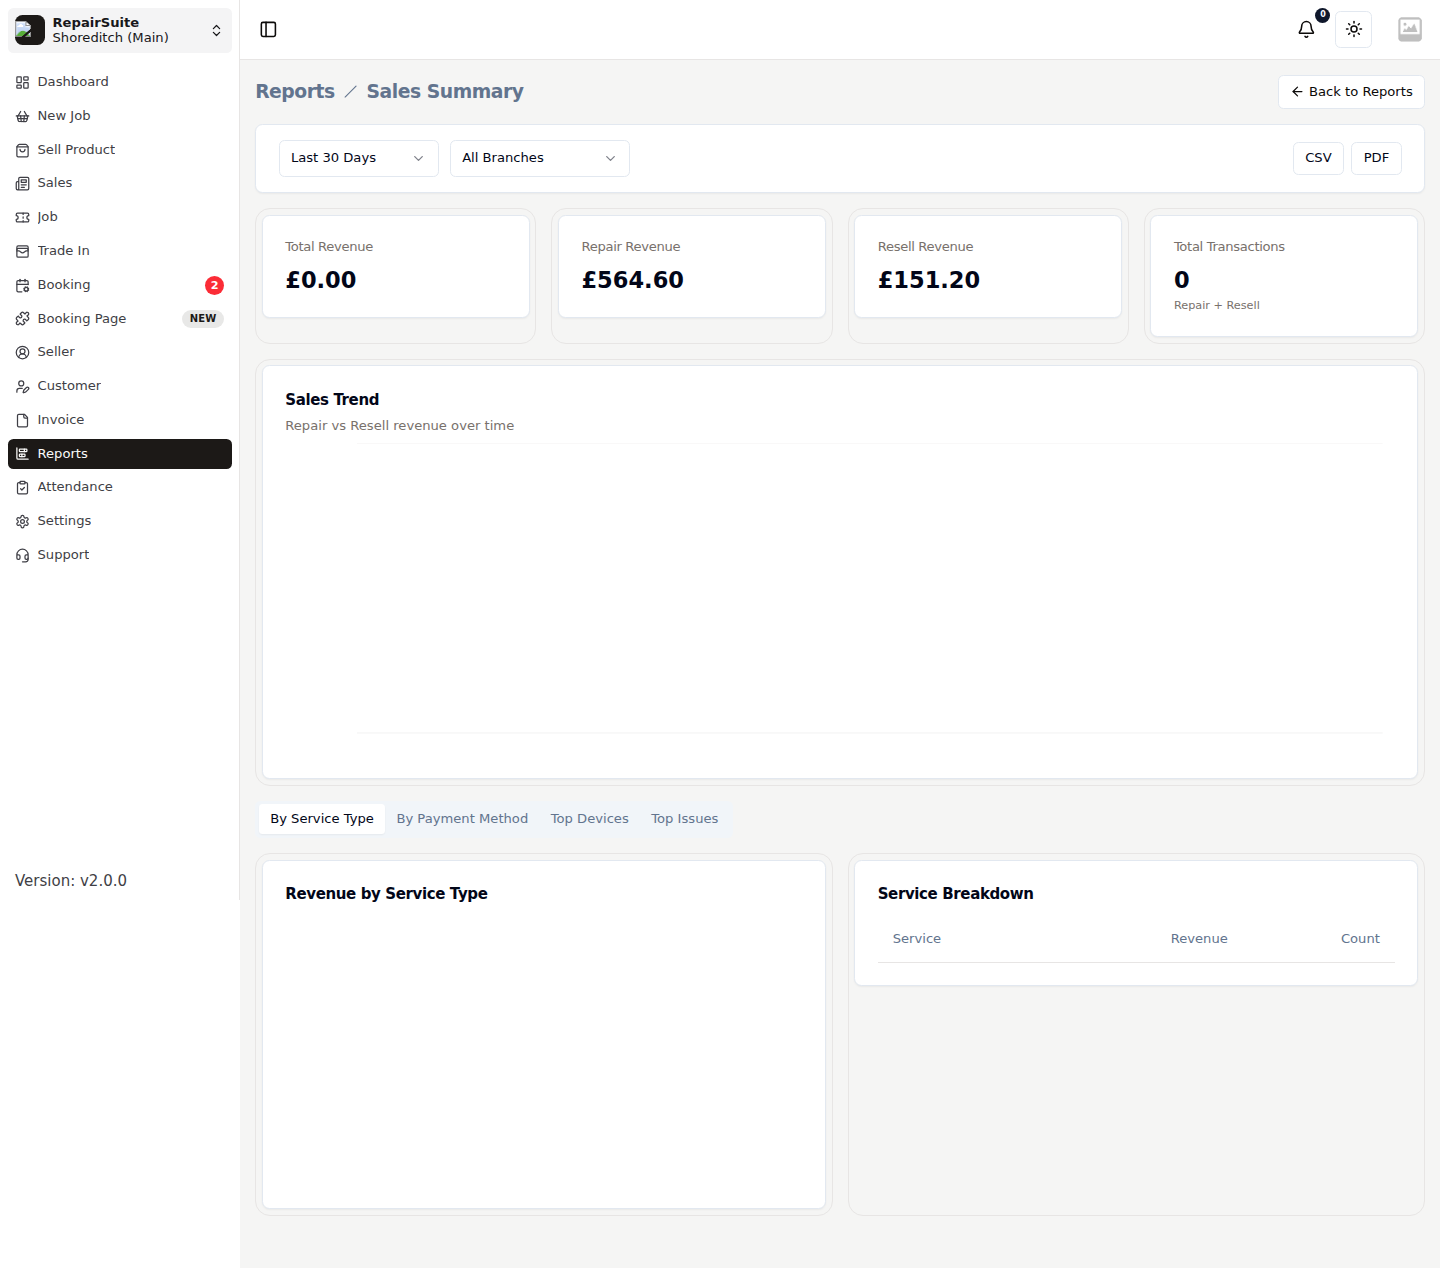
Revenue broken down by repair versus resell, with your top devices and services over the period. The first place to look when you want to know what sold.
Profit Margin
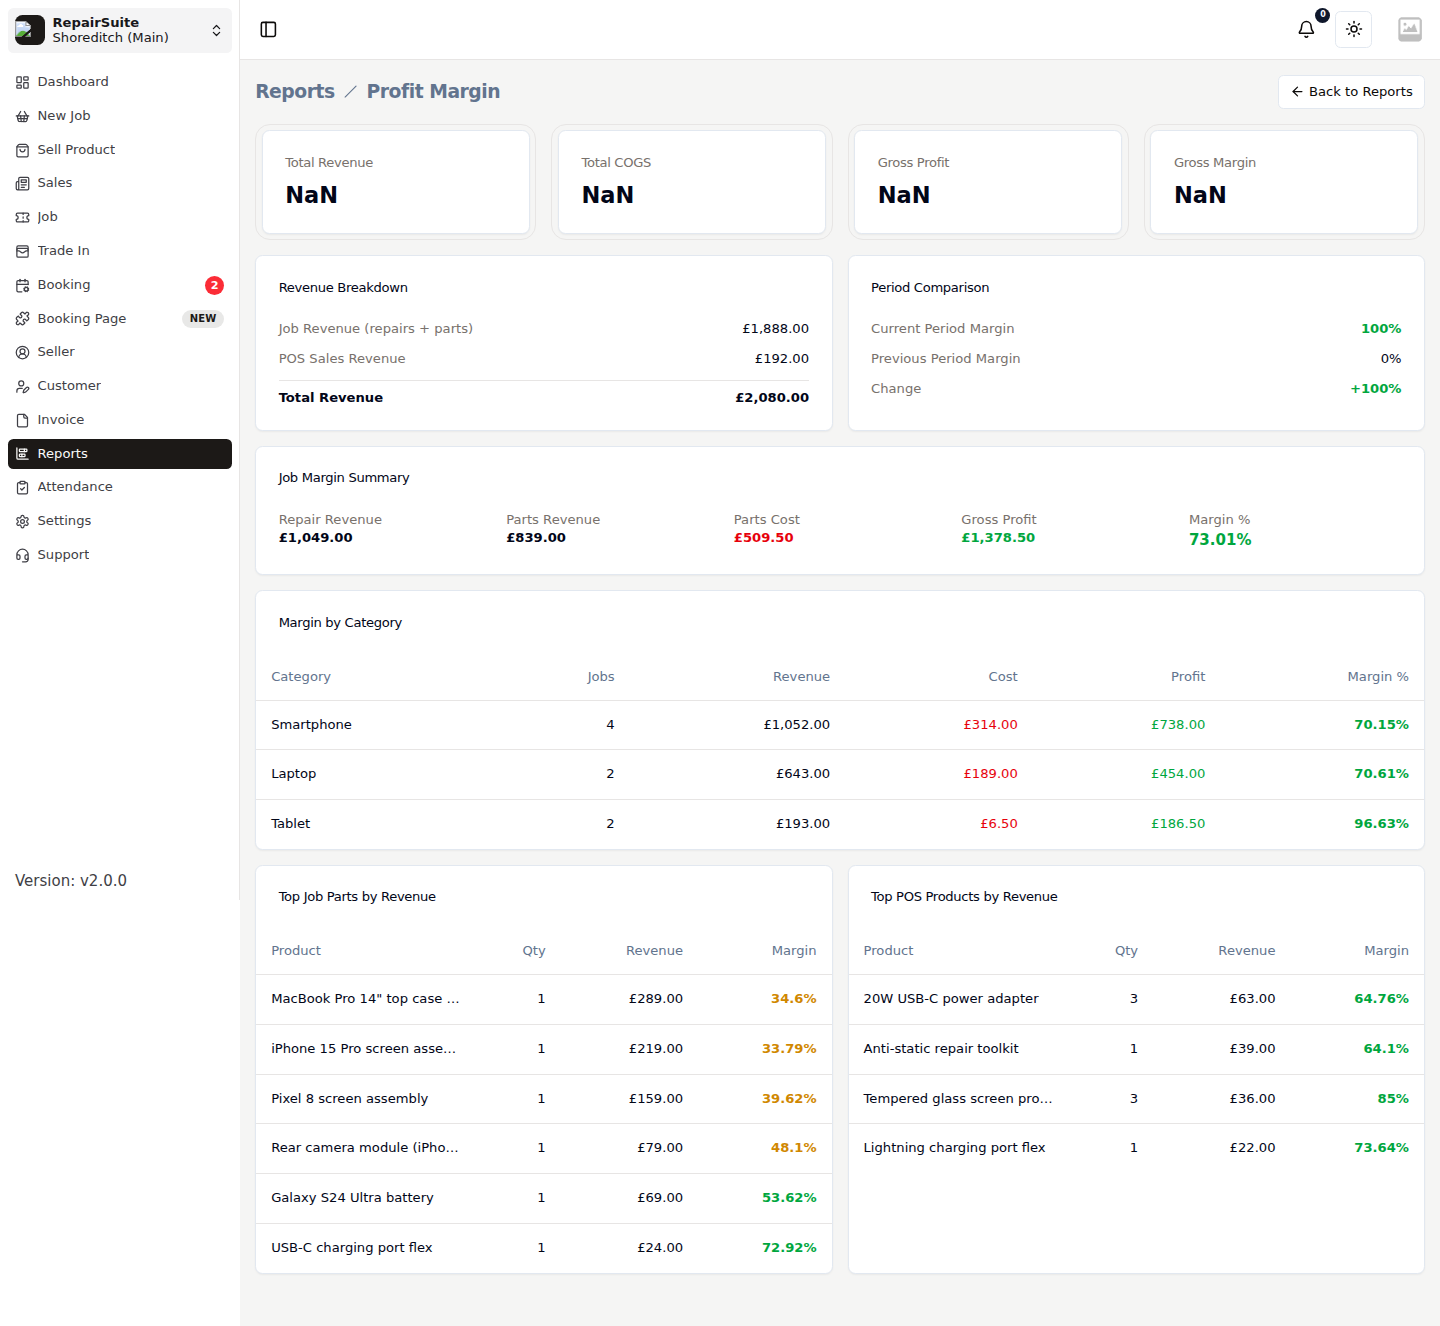
Gross margin analysis. Revenue, cost of goods sold and margin, broken down by job, product and category, with a trend across the period and a comparison against the previous one. It covers both repair jobs and counter sales, so you can see which parts actually make money once the purchase price is taken off.
Unified Inventory
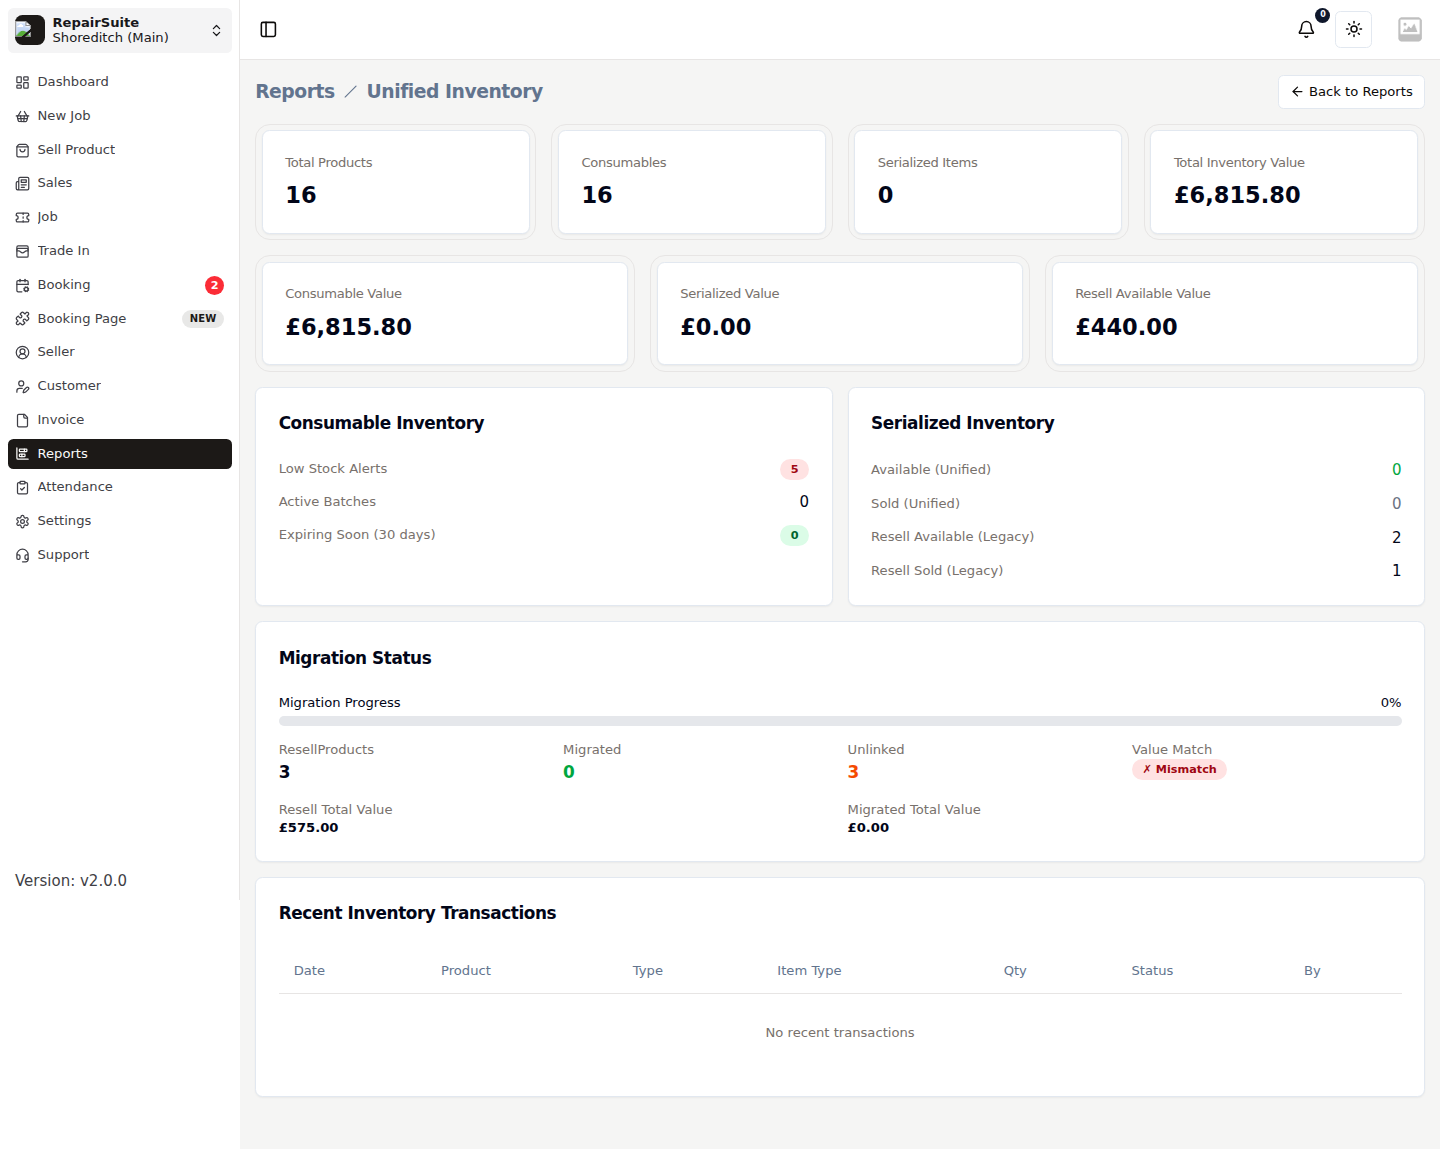
A combined view of every kind of stock you hold — consumable parts, serialized devices and trade-in units — with a value breakdown. It also shows migration status while a shop is moving onto the transaction-ledger inventory system.
KPI Dashboard
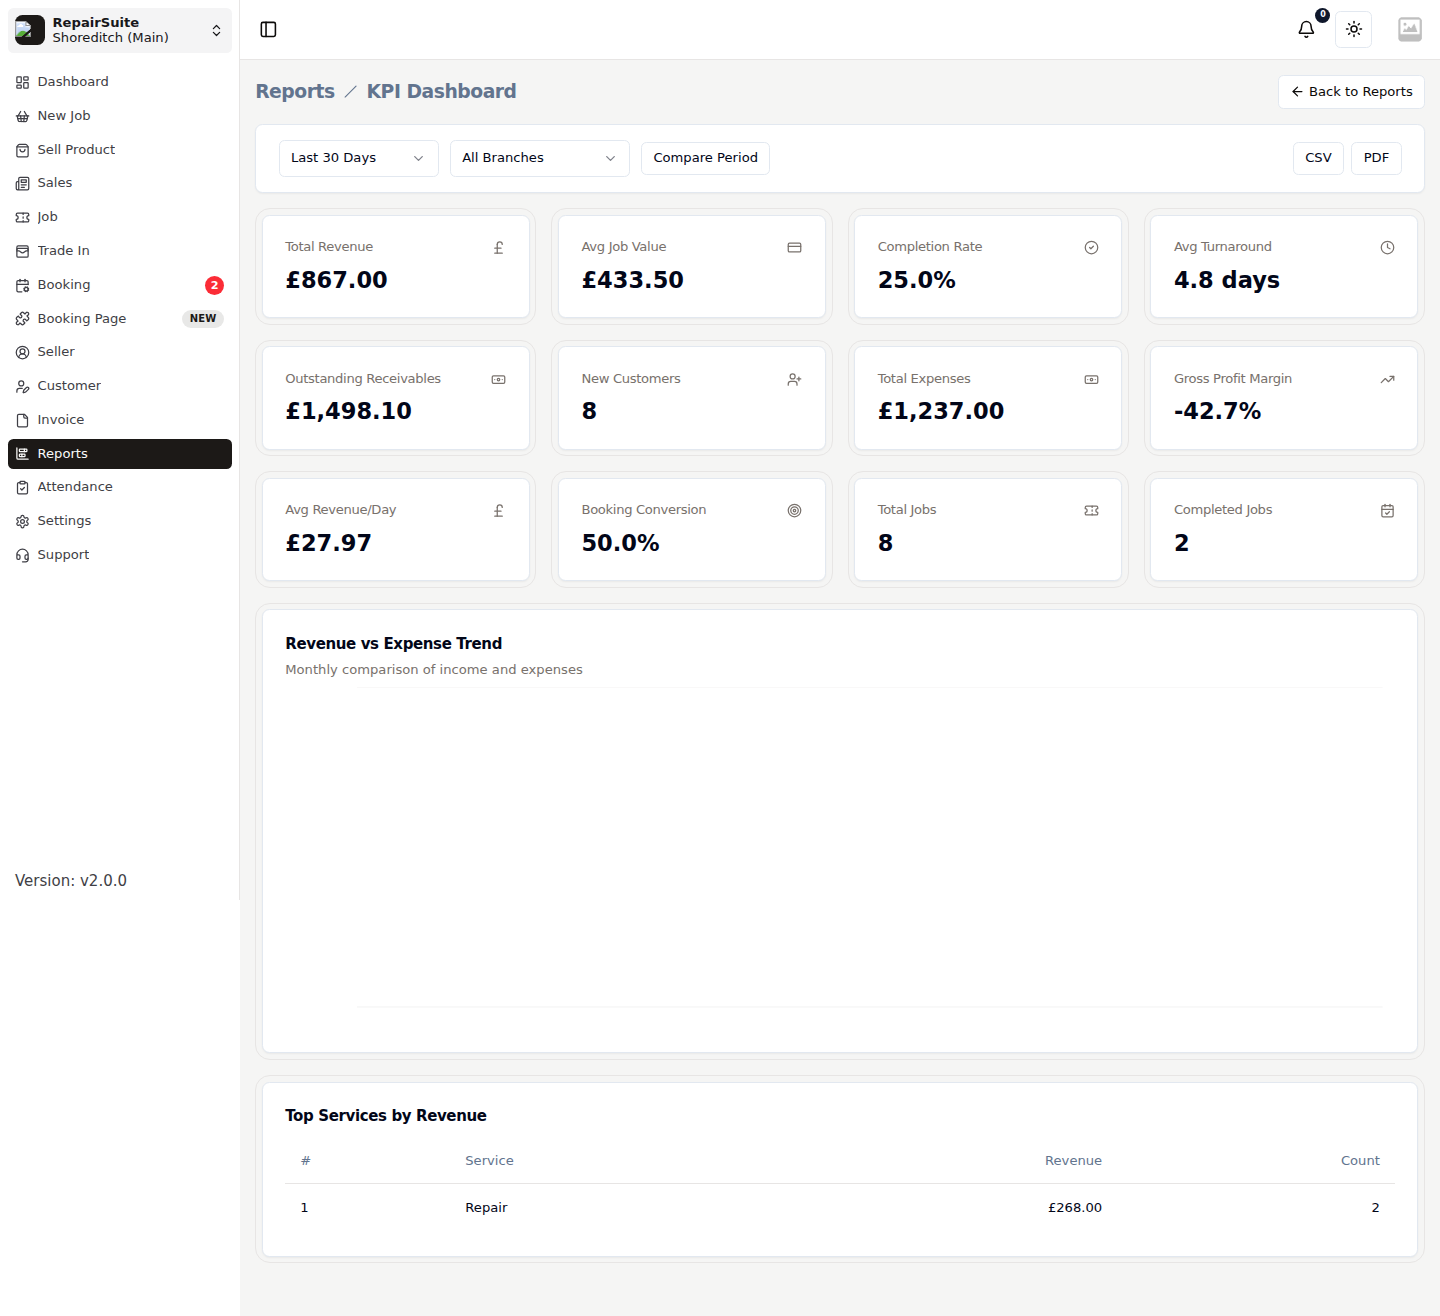
Headline indicators in one place: revenue, job volume, turnaround time and expenses, each with its trend.
Transaction Log
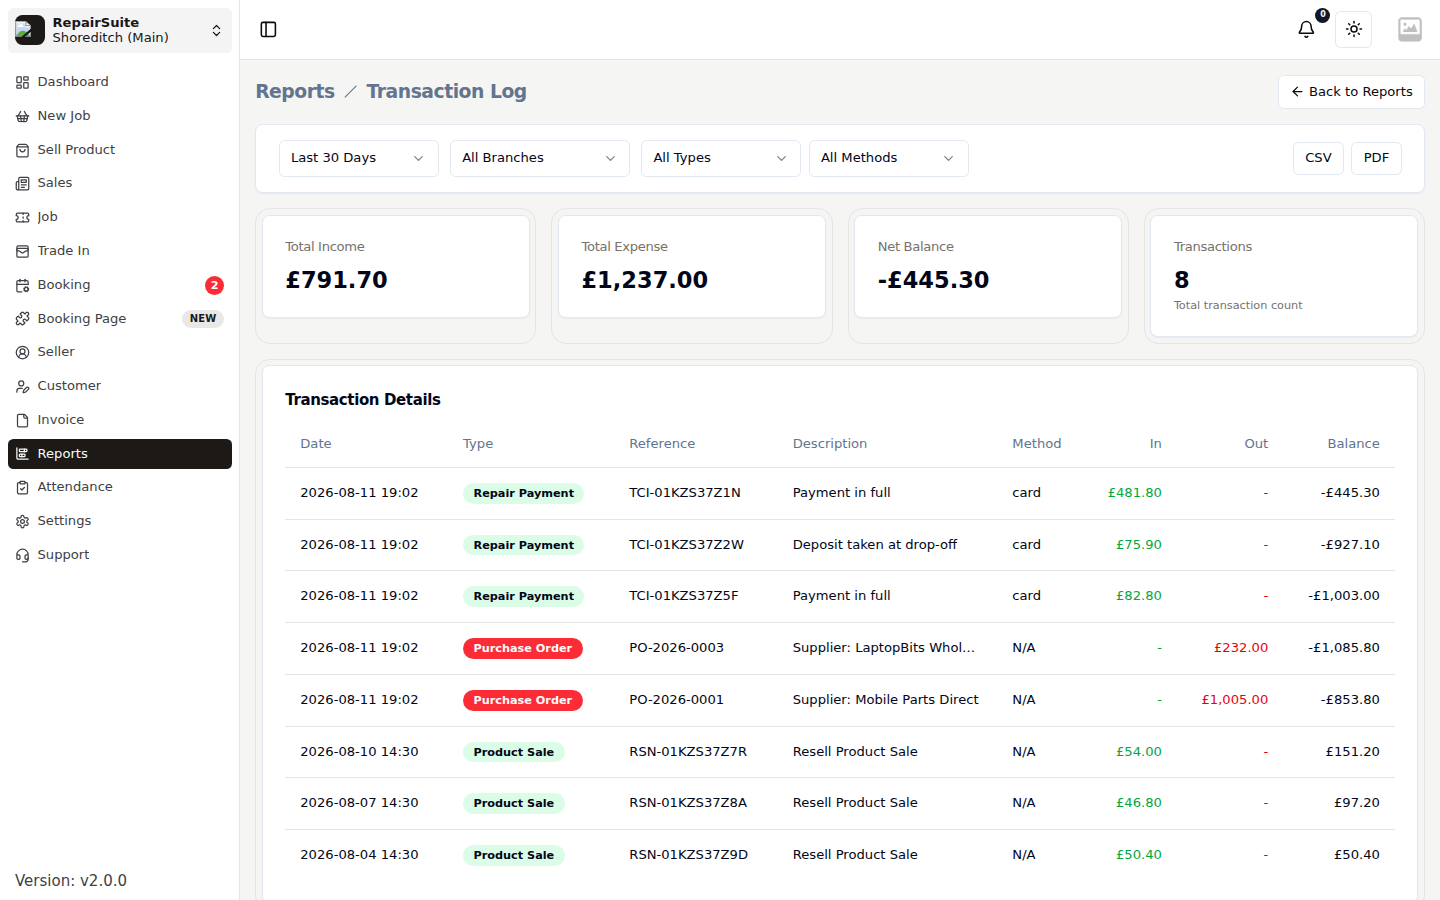
A complete, chronological record of income and expense transactions with a running balance — the closest thing to a ledger view.
Employee Productivity
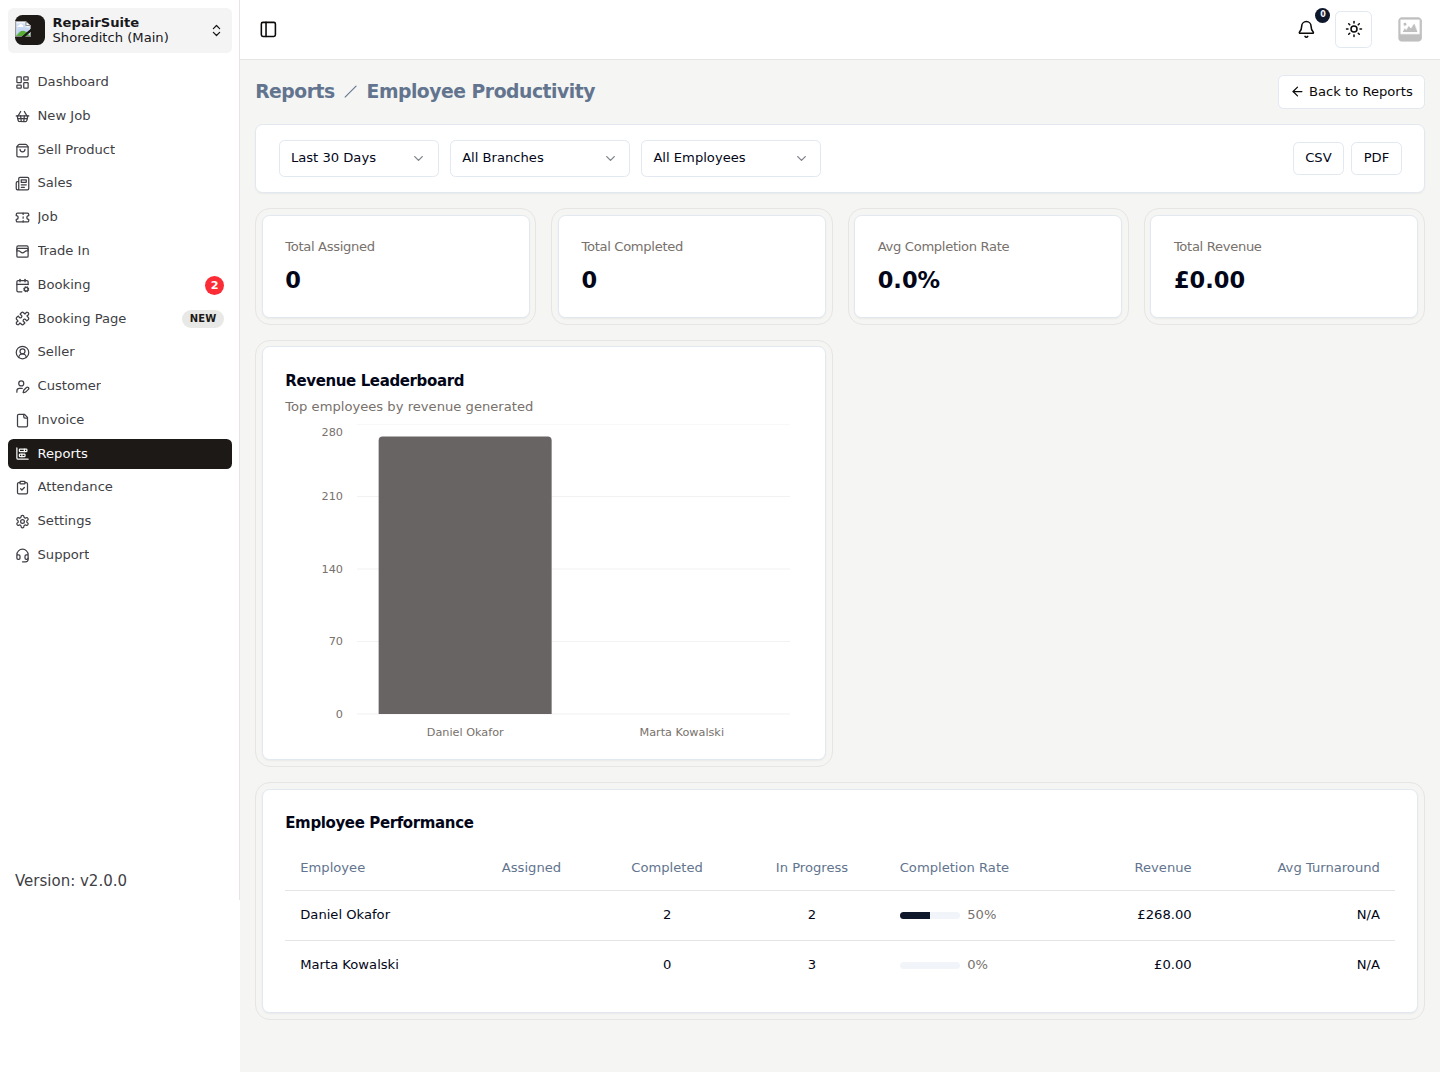
Per-employee performance: jobs assigned, jobs completed, completion rate and revenue generated. Pairs with Attendance when you are working out staffing.
The rest
| Report | What it answers |
|---|---|
| Expense Report | Where the money went, by category, with trends and comparisons |
| Reconciliation | Invoiced versus collected, outstanding balances and aging |
| Real-Time Sync | Today so far — live queue, revenue and bookings |
| Growth Forecast | Revenue and customer trend lines with a linear-regression projection |
Exporting
Every report has an Export control that downloads the current view — same filters, same date range — as CSV, ready for a spreadsheet or your accountant.
Access
Reports are gated by the report_show permission, and the module can be hidden entirely from the sidebar in Menu Settings. Give it to the roles that should see shop-wide financial data — see Roles & Members.